You set up monitoring to get peace of mind…
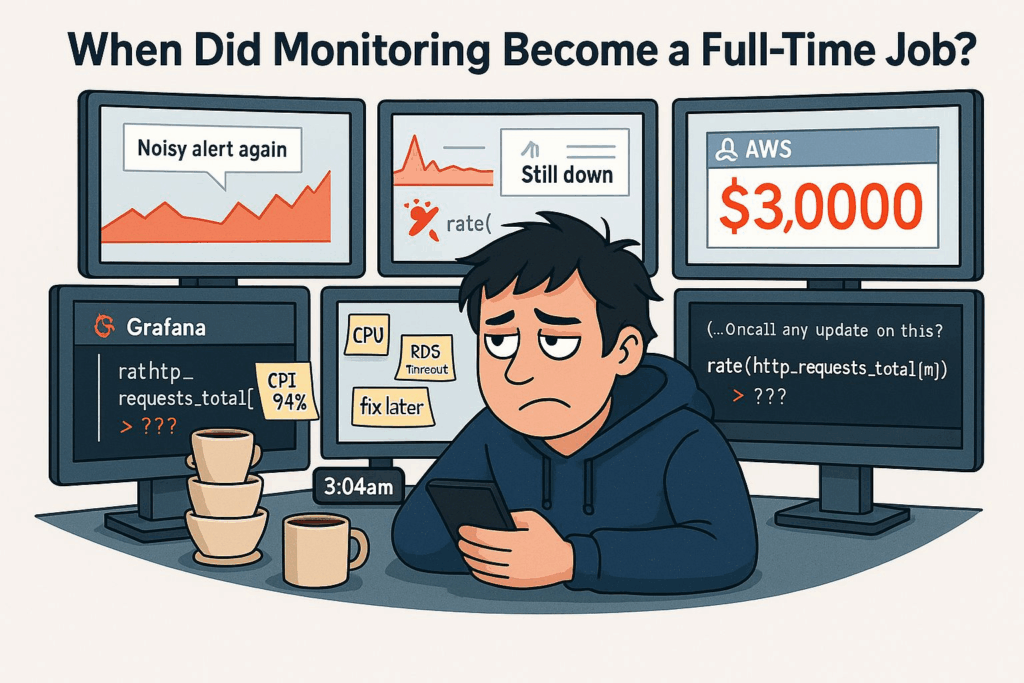
Now you’re managing 6 dashboards, 3 alerting systems, and a Slack channel that never sleeps.
Prometheus. Grafana. Loki. Datadog. ELK. Sentry. PagerDuty…
Somehow, we went from “just add a metrics exporter” to needing a PhD to figure out why latency spiked at 3am.
We just wanted observability…
Real pain points:
- 🔔 Useless alerts from noisy thresholds or missing critical conditions
- 🧩 Overlapping tools — logs in one place, metrics in another, traces nowhere
- 🕳️ “Black box” exporters — especially with managed services (hello RDS, Cloud SQL)
- 📊 Dashboards no one reads… until something’s on fire
- 🧼 Or worse: the dashboard looks fine, but your service is still down
- 💸 And unexpected $3,000 cloud bills, of course
At what point did “knowing your system is alive” turn into “babysitting your system’s feelings”?
So, I’m genuinely curious:
👉 What’s your current monitoring stack? Prometheus + Grafana? Datadog? New Relic? OpenTelemetry? 👉 Would you actually recommend it to anyone else?